ArtsAutosBooksBusinessEducationEntertainmentFamilyFashionFoodGamesGenderHealthHolidaysHomeHubPagesPersonal FinancePetsPoliticsReligionSportsTechnologyTravel

Using the Histogram Tool from the Analysis ToolPak in Excel 2007 and Excel 2010

Updated on May 1, 2013

Introduction

Hi and welcome to the last in my series on the Analysis ToolPak which is an add-in available in both Excel 2007 and Excel 2010. The ToolPak allows you to perform sophisticated statistical and mathematical analysis on your data using a number of powerful tools.

Today we will look at the Histogram Tool. This tool allows you to analyse your data and show in chart form how your data is distributed. In today’s example, we will again look at the results that my (fictional) students obtained in their recent exams. Excel 2007 and Excel 2010 allow you to define the boundary values or bin ranges (in my example, these are grade boundaries). You can also calculate cumulative percentages and order the histogram from the highest value to the lowest. The figure below shows the results expressed as a histogram.
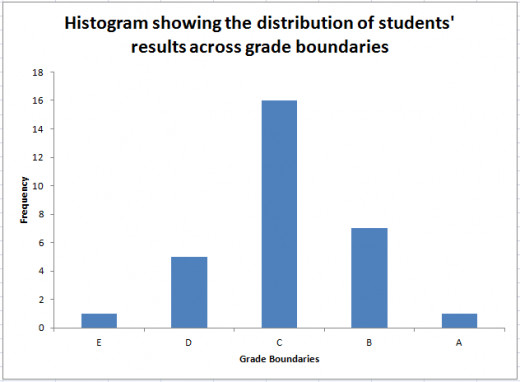
Example of a Histogram, created using the Histogram Tool from the Analysis Toolpak in Excel 2007 and Excel 2010.
Example of a Histogram, created using the Histogram Tool from the Analysis Toolpak in Excel 2007 and Excel 2010. | Source

I have a hub that covers adding the Analysis ToolPak to both Excel 2007 and Excel 2010 and also discusses how to make the ToolPak visible should it be already selected but not showing in Excel. That hub can be found here:

http://robbiecwilson.hubpages.com/hub/Using-the-Analysis-ToolPak-in-Excel-2007-and-Excel-2010

Creating the boundary values or bin values to be used in the Histogram in Excel 2007 and Excel 2010

Before we create our histogram we need to consider the boundaries we will use (referred to as bin values in Excel). As I am considering my students results, I will use the following grade boundaries:
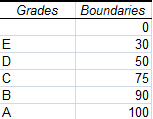
The Boundaries or Bin Values we will use to create our Histogram in Excel 2007 and Excel 2010.
The Boundaries or Bin Values we will use to create our Histogram in Excel 2007 and Excel 2010. | Source

As you can see from the above figure, there are six boundaries and only five grades. This is because, an E is 0 – 30, a D is 30 – 50 and so on, with an A being 90 to 100. Now that we have the boundaries defined as well as their labels (contained in the column headed Grades) we can begin to construct our Histogram.

Creating a Histogram in Excel 2007 and Excel 2010

The next step is to now create the Histogram itself. This tool is available via the Data Analysis button which is part of the Analysis group on the Data tab.

  • Click the Data Analysis button and select Histogram
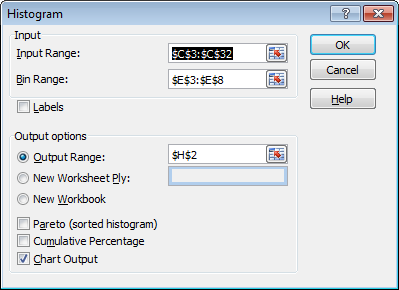
  • The Histogram dialogue box will open

Creating a Histogram, using the Histogram Tool from the Analysis Toolpak in Excel 2007 and Excel 2010.
Creating a Histogram, using the Histogram Tool from the Analysis Toolpak in Excel 2007 and Excel 2010. | Source
  • The Input Range is the range containing your data (in this case the marks my students received in their test)
  • The Bin Range is the boundaries you wish to use to separate your data (if you don’t define boundaries, Excel will separate your data evenly and create them for you)
  • If you use labels at the top of your columns, click the Labels option
  • Configure your Output Range, or create a New Worksheet or Workbook depending on your preference
  • Pareto (or sorted Histogram) will sort your data from most frequent to least frequent
  • Should you need to include the cumulative percentage in your histogram, select this option

Finally, and VERY IMPORTANTLY select Chart Output or Excel 2007 / Excel 2010 will not create a chart for you (it will instead just create the table headed Bin and Frequency without the histogram itself)
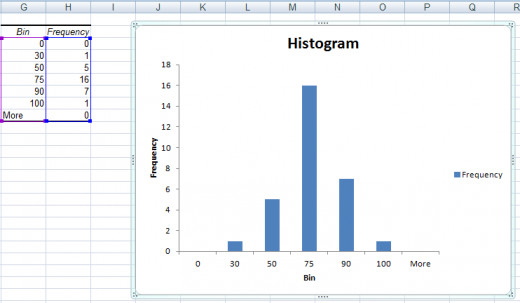
Histogram created using the Histogram Tool from the Analysis Toolpak in Excel 2007 and Excel 2010.
Histogram created using the Histogram Tool from the Analysis Toolpak in Excel 2007 and Excel 2010. | Source

The above figure shows the resulting histogram. As you can see we need to tidy this up but we have a nice bell curve distribution of results. First:

  • Adjust the purple and blue boxes to exclude the first and last row of the results as they do not contain any data, just the bottom and top boundary values
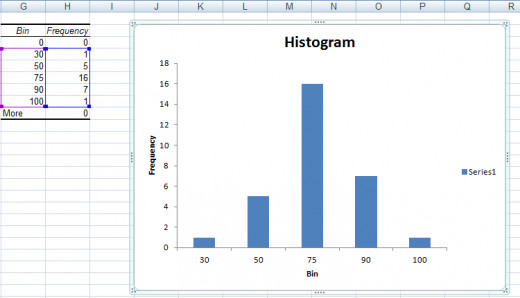
Histogram without the empty first and last columns, created using the Histogram Tool from the Analysis Toolpak in Excel 2007 and Excel 2010.
Histogram without the empty first and last columns, created using the Histogram Tool from the Analysis Toolpak in Excel 2007 and Excel 2010. | Source
  • Next, change the chart title to something more meaningful (click on the title and rename it)
  • Click and rename the Horizontal Axis to something more useful
  • Select Series1 and delete it as we have only one data series so it is not giving us any useful additional information
  • Right click on the chart and choose Select Data
  • Click Edit under Horizontal (Category) Axis Labels
  • Select the section of the column containing your labels
  • Click OK twice to return to your chart

You will now have your completed chart:
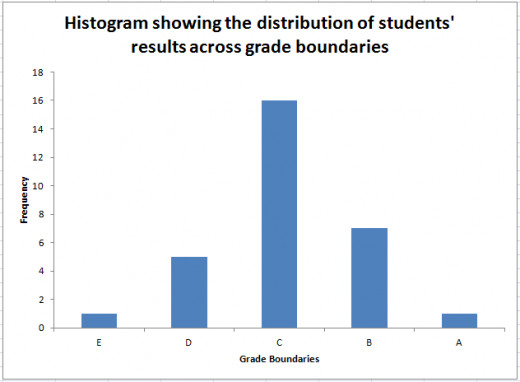
Completed chart, created using the Histogram Tool from the Analysis Toolpak in Excel 2007 and Excel 2010.
Completed chart, created using the Histogram Tool from the Analysis Toolpak in Excel 2007 and Excel 2010. | Source

If you are require further information regarding creating charts in Excel 2007, I have a hub which goes into much more detail around creating charts and graphs which can be found here:

http://robbiecwilson.hubpages.com/hub/Creating-charts-and-graphs-in-Excel-2007

Conclusion

The Histogram Tool which is part of the Analysis ToolPak in Excel 2007 and Excel 2010 is a very useful tool for illustrating how your data is distributed across configurable boundaries (called bin ranges by Excel).

In my example, I took the results of a recent exam and used the tool to illustrate how the results were distributed across the grades from E to A. The histogram can also show the data with the bin or boundaries arranged from highest to lowest (Pareto) and you can also use cumulative percentages too should your data require it.

I have a number of other hubs illustrating how to use a number of the other statistical and mathematical tools, which include:
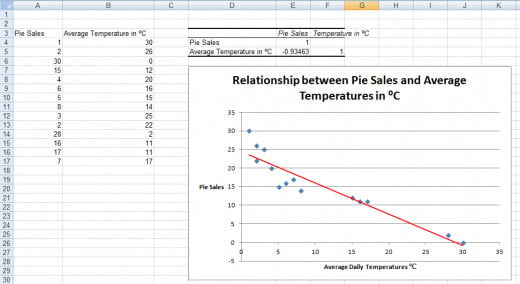
Example of a Correlation, created using the Correlation Tool from the Analysis Toolpak in Excel 2007 and Excel 2010.
Example of a Correlation, created using the Correlation Tool from the Analysis Toolpak in Excel 2007 and Excel 2010. | Source
Example of a table showing data variation, created using the Sampling Tool from the Analysis Toolpak in Excel 2007 and Excel 2010.
Example of a table showing data variation, created using the Sampling Tool from the Analysis Toolpak in Excel 2007 and Excel 2010. | Source
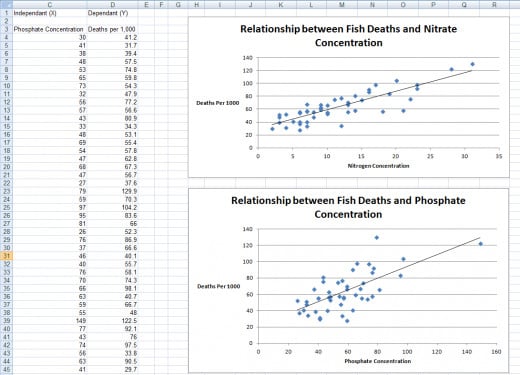
Example of a Regression, created using the Regression Tool from the Analysis Toolpak in Excel 2007 and Excel 2010.
Example of a Regression, created using the Regression Tool from the Analysis Toolpak in Excel 2007 and Excel 2010. | Source
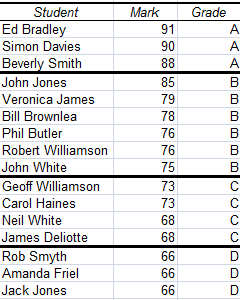
Example of a ranked table with percentiles, created using the Rank and Percentile Tool from the Analysis Toolpak in Excel 2007 and Excel 2010.
Example of a ranked table with percentiles, created using the Rank and Percentile Tool from the Analysis Toolpak in Excel 2007 and Excel 2010. | Source
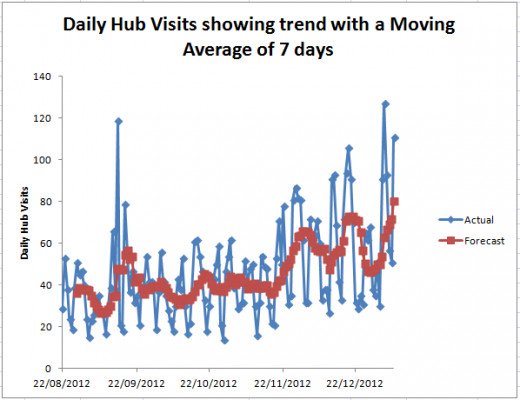
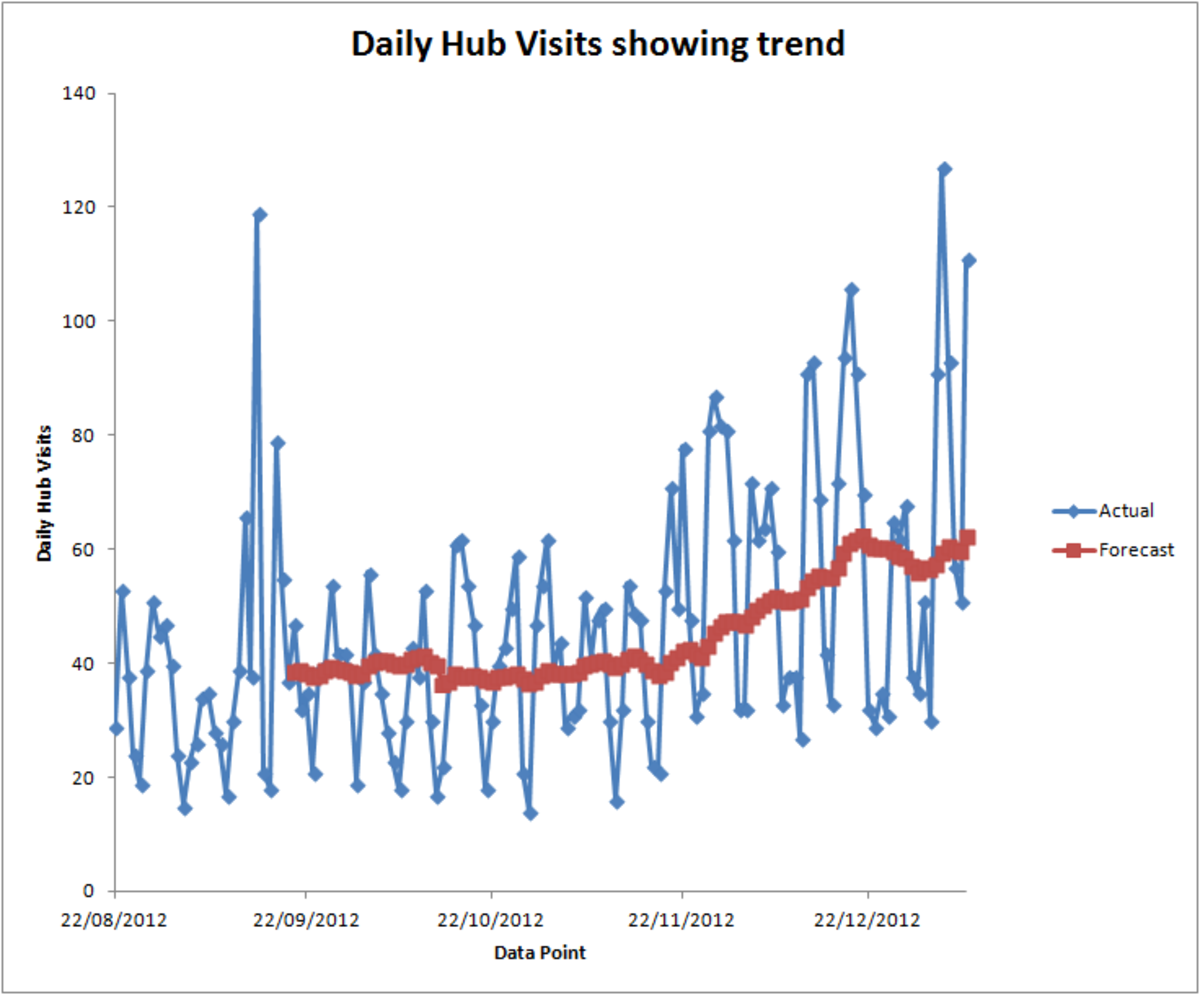
Example of a Moving Average, created using the Moving Average Tool from the Analysis Toolpak in Excel 2007 and Excel 2010.

Correlation: is a relationship between two variables and is either positive (both variables go up), negative (one goes up, the other goes down) or no relationship (the variables have no relationship). I investigate the correlation between pie sales and daily temperatures in my hub:

http://robbiecwilson.hubpages.com/hub/Using-the-Correlation-Tool-from-the-Excel-2007-and-Excel-2010-Analysis-ToolPak

Sampling: allows you to take a random sample from a larger population and perform analysis on this sample. My example in this hub is the creation of lottery numbers randomly chosen from the pool of possible numbers:

http://robbiecwilson.hubpages.com/hub/Use-the-Sampling-Tool-in-the-Excel-2007-and-Excel-2010-Analysis-ToolPak-for-sampling-and-to-analyse-periodic-variations

Regression: utilising this tool, you can visually summarise the relationship between variables. You can then predict variables based on the known results of other variables. I investigate if there is a relationship between Phosphate and Nitrogen concentrations of fish mortality in my hub:

http://robbiecwilson.hubpages.com/hub/Using-the-Regression-Tool-from-the-Analysis-ToolPak-in-Excel-2007-and-Excel-2010

Rank and Percentile: permits the ranking of your data and the assigning of percentiles to that data. In my example, my students sitting an exam are assigned grades based on their rank in the class.

http://robbiecwilson.hubpages.com/hub/Use-the-Rank-and-Percentile-Tool-from-the-Analysis-ToolPak-in-Excel-2007-and-Excel-2010-to-create-ranking-tables

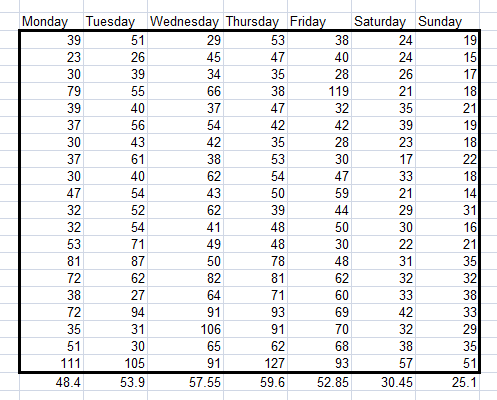
Moving Average: this tool is used to detect trends in your data. I look at my hub traffic over time and look to see if the data is trending upwards or not. The tool creates a trend line which will illustrate a trend if one is present.

http://robbiecwilson.hubpages.com/hub/Using-the-Moving-Average-Tool-from-the-Excel-2007-and-Excel-2010-Analysis-ToolPak

Many thanks for reading; I do hope that you have found it both informative and useful. Please feel free to leave any comments you may have below.

And Finally...

Which Tool from the Analysis ToolPak in Excel 2007 and Excel 2010 do you intend to (or already regularly) use?

See results
working

This website uses cookies

As a user in the EEA, your approval is needed on a few things. To provide a better website experience, hubpages.com uses cookies (and other similar technologies) and may collect, process, and share personal data. Please choose which areas of our service you consent to our doing so.

For more information on managing or withdrawing consents and how we handle data, visit our Privacy Policy at: https://corp.maven.io/privacy-policy

Show Details
Necessary
HubPages Device IDThis is used to identify particular browsers or devices when the access the service, and is used for security reasons.
LoginThis is necessary to sign in to the HubPages Service.
Google RecaptchaThis is used to prevent bots and spam. (Privacy Policy)
AkismetThis is used to detect comment spam. (Privacy Policy)
HubPages Google AnalyticsThis is used to provide data on traffic to our website, all personally identifyable data is anonymized. (Privacy Policy)
HubPages Traffic PixelThis is used to collect data on traffic to articles and other pages on our site. Unless you are signed in to a HubPages account, all personally identifiable information is anonymized.
Amazon Web ServicesThis is a cloud services platform that we used to host our service. (Privacy Policy)
CloudflareThis is a cloud CDN service that we use to efficiently deliver files required for our service to operate such as javascript, cascading style sheets, images, and videos. (Privacy Policy)
Google Hosted LibrariesJavascript software libraries such as jQuery are loaded at endpoints on the googleapis.com or gstatic.com domains, for performance and efficiency reasons. (Privacy Policy)
Features
Google Custom SearchThis is feature allows you to search the site. (Privacy Policy)
Google MapsSome articles have Google Maps embedded in them. (Privacy Policy)
Google ChartsThis is used to display charts and graphs on articles and the author center. (Privacy Policy)
Google AdSense Host APIThis service allows you to sign up for or associate a Google AdSense account with HubPages, so that you can earn money from ads on your articles. No data is shared unless you engage with this feature. (Privacy Policy)
Google YouTubeSome articles have YouTube videos embedded in them. (Privacy Policy)
VimeoSome articles have Vimeo videos embedded in them. (Privacy Policy)
PaypalThis is used for a registered author who enrolls in the HubPages Earnings program and requests to be paid via PayPal. No data is shared with Paypal unless you engage with this feature. (Privacy Policy)
Facebook LoginYou can use this to streamline signing up for, or signing in to your Hubpages account. No data is shared with Facebook unless you engage with this feature. (Privacy Policy)
MavenThis supports the Maven widget and search functionality. (Privacy Policy)
Marketing
Google AdSenseThis is an ad network. (Privacy Policy)
Google DoubleClickGoogle provides ad serving technology and runs an ad network. (Privacy Policy)
Index ExchangeThis is an ad network. (Privacy Policy)
SovrnThis is an ad network. (Privacy Policy)
Facebook AdsThis is an ad network. (Privacy Policy)
Amazon Unified Ad MarketplaceThis is an ad network. (Privacy Policy)
AppNexusThis is an ad network. (Privacy Policy)
OpenxThis is an ad network. (Privacy Policy)
Rubicon ProjectThis is an ad network. (Privacy Policy)
TripleLiftThis is an ad network. (Privacy Policy)
Say MediaWe partner with Say Media to deliver ad campaigns on our sites. (Privacy Policy)
Remarketing PixelsWe may use remarketing pixels from advertising networks such as Google AdWords, Bing Ads, and Facebook in order to advertise the HubPages Service to people that have visited our sites.
Conversion Tracking PixelsWe may use conversion tracking pixels from advertising networks such as Google AdWords, Bing Ads, and Facebook in order to identify when an advertisement has successfully resulted in the desired action, such as signing up for the HubPages Service or publishing an article on the HubPages Service.
Statistics
Author Google AnalyticsThis is used to provide traffic data and reports to the authors of articles on the HubPages Service. (Privacy Policy)
ComscoreComScore is a media measurement and analytics company providing marketing data and analytics to enterprises, media and advertising agencies, and publishers. Non-consent will result in ComScore only processing obfuscated personal data. (Privacy Policy)
Amazon Tracking PixelSome articles display amazon products as part of the Amazon Affiliate program, this pixel provides traffic statistics for those products (Privacy Policy)
ClickscoThis is a data management platform studying reader behavior (Privacy Policy)